Posts

Showing posts from May, 2017

Choropleth Maps

Image
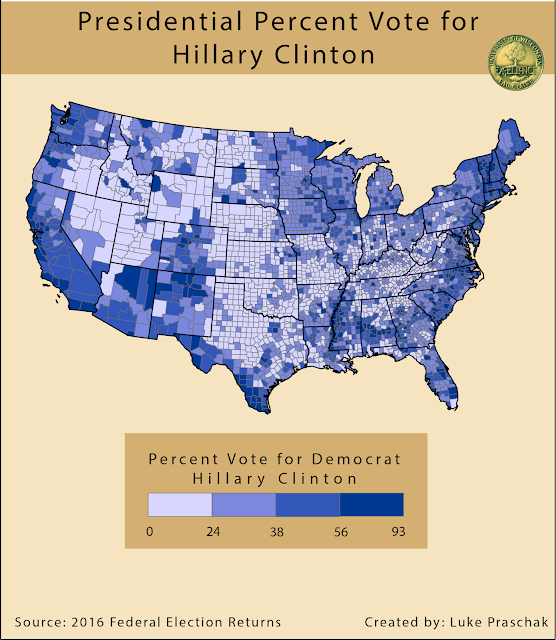
Overview: The second project in Cartographic Design was to create an effective choropleth map. In order to really grab the attention of our audience we used the 2016 presidential election results. Some rules to keep in mind when designing an effective choropleth map is picking colors that best fit what is being explained. In this case I have democratic and republican vote. Blue matches the democrat party color and red matches republican. Another important rule is to choose the appropriate number of classes. Too many classes can lose the viewer in trying to understand differences. In the two maps below I chose to use 4 classes to display the percent vote because I believe each color has enough distinction to show the viewer differences between counties. After color and classes are established, cleaning up the numbers being displayed is next. Numbers can sometimes includes long decimals and the best thing to do is just to eliminate the decimals. To finish the final products, I broug

GPS Mapping Project

Image
Overview: The goal of this exercise was to deploy another geodatabase to Arc Collector with the intention to answer a research question of my own. The research question applied looks to analyze how the condition as well as the type of sidewalk differs in a frequent and non-frequent flooded areas.  The study area takes place on the Chippewa River State Trail, that is within the student housing area (west side of Chippewa River), and a portion of the University of Wisconsin-Eau Claire campus. This trail, used by local residents and college students, is regularly walked, biked, in-line staked, etc. Results/Conclusion: Sidewalk cracks can seem to a minor annoyance, but they can actually be a serious hazard. Cracks on a sidewalk can lead to pedestrians tripping or potentially bring a skateboarder or biker to an unexpected halt, all in which could lead to an injury. So maintaining sidewalks, especially ones that are used quite frequently becomes an important necessity for maintaining

Five Strategies to Color Symbolization Poster

Image
Overview: An important component to creating an understandable and stand out map is color. Five color strategies are used to show the different scheme used to understand what is being display. The five color scheme used are single hue, part spectrum, bi-model, different, and advance & retreat. Each color strategy is defined in the image below.

2016 Presidential Election Maps

Image
Overview: One of our next projects in the class involved an analysis of the 2016 presidential election results. I chose to take a closer look at not only 2016, but the 2008 and 2012 presidential election results. I gathered my election data from the 2016 Federal Election Returns. The data provided the number of votes for each candidate by country for each state. In order to find the percentage I took the total number of votes divided by the candidates numbers of votes. I matched each percentage to the appropriate candidate and color. Finally, I brought the election results into ArcScene to display a 3D view of the number of Democratic votes in each country that favored the Democratic candidate.

Meet & Greet

Image
Overview: To begin Cartographic Design, we used the best thing us geographers know, which is to create maps to introduce each other. My name is Luke Praschak and I am from a small town called Somerset located in western Wisconsin. Somerset is most famous for it's summer tubing on the Apple River and it's large amphitheater used to host world class musician's.