2016 Presidential Election Maps
Overview:
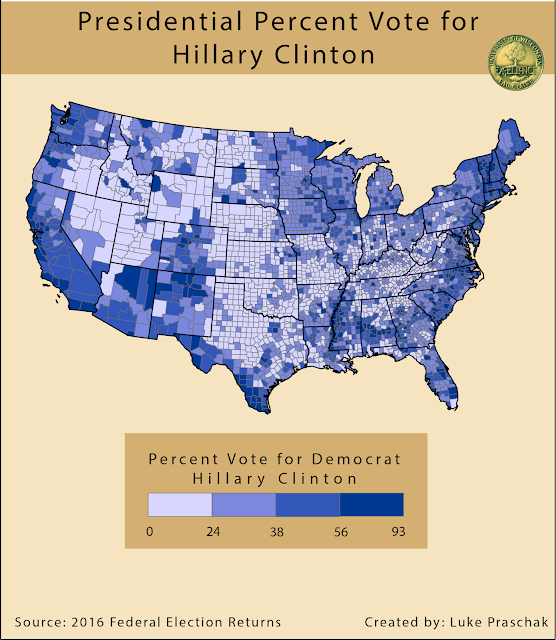
One of our next projects in the class involved an analysis of the 2016 presidential election results. I chose to take a closer look at not only 2016, but the 2008 and 2012 presidential election results. I gathered my election data from the 2016 Federal Election Returns. The data provided the number of votes for each candidate by country for each state. In order to find the percentage I took the total number of votes divided by the candidates numbers of votes. I matched each percentage to the appropriate candidate and color. Finally, I brought the election results into ArcScene to display a 3D view of the number of Democratic votes in each country that favored the Democratic candidate.

One of our next projects in the class involved an analysis of the 2016 presidential election results. I chose to take a closer look at not only 2016, but the 2008 and 2012 presidential election results. I gathered my election data from the 2016 Federal Election Returns. The data provided the number of votes for each candidate by country for each state. In order to find the percentage I took the total number of votes divided by the candidates numbers of votes. I matched each percentage to the appropriate candidate and color. Finally, I brought the election results into ArcScene to display a 3D view of the number of Democratic votes in each country that favored the Democratic candidate.


Comments
Post a Comment